2%
A discreet project of mine
2% is an experimental project where I leverage data engineering and data science techniques to try and predict stock market movements.
This page will not disclose specific algorithms or proprietary methods, but will focus on sharing insights about the development process and the results achieved along the way.
Grid search results on some custom indicators
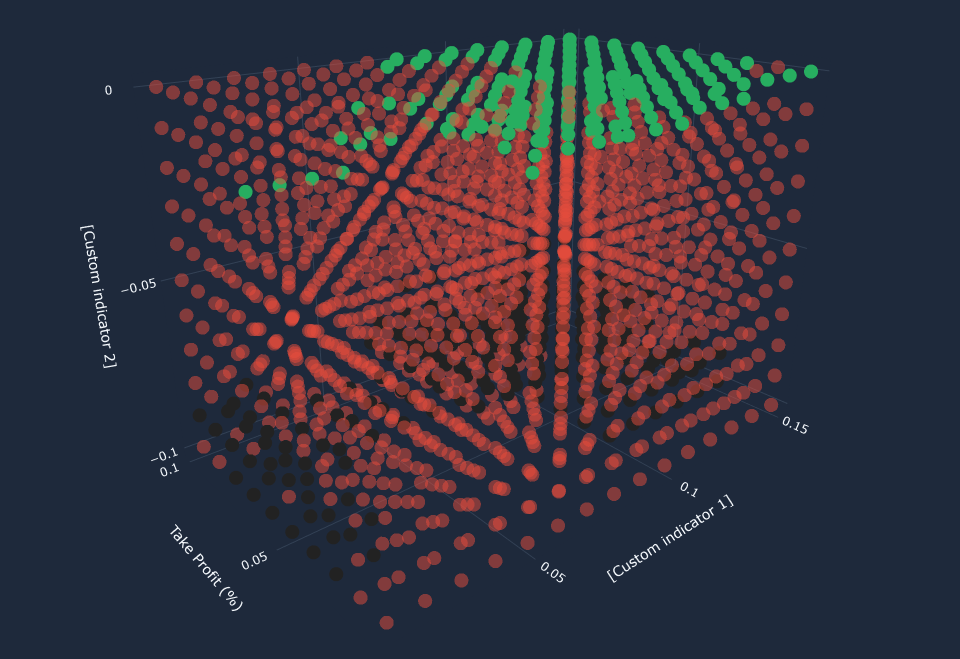
The backtests were performed on stock market data since 2018, representing approximately 1,500 trading days (one row per day).
In the graph, black dots represent negative results. Red dots are positive results that underperformed the CAC40 index (worse than being neutral). Green dots outperformed the CAC40. There is a strong positive correlation between my two custom indicators and the strategy’s results.